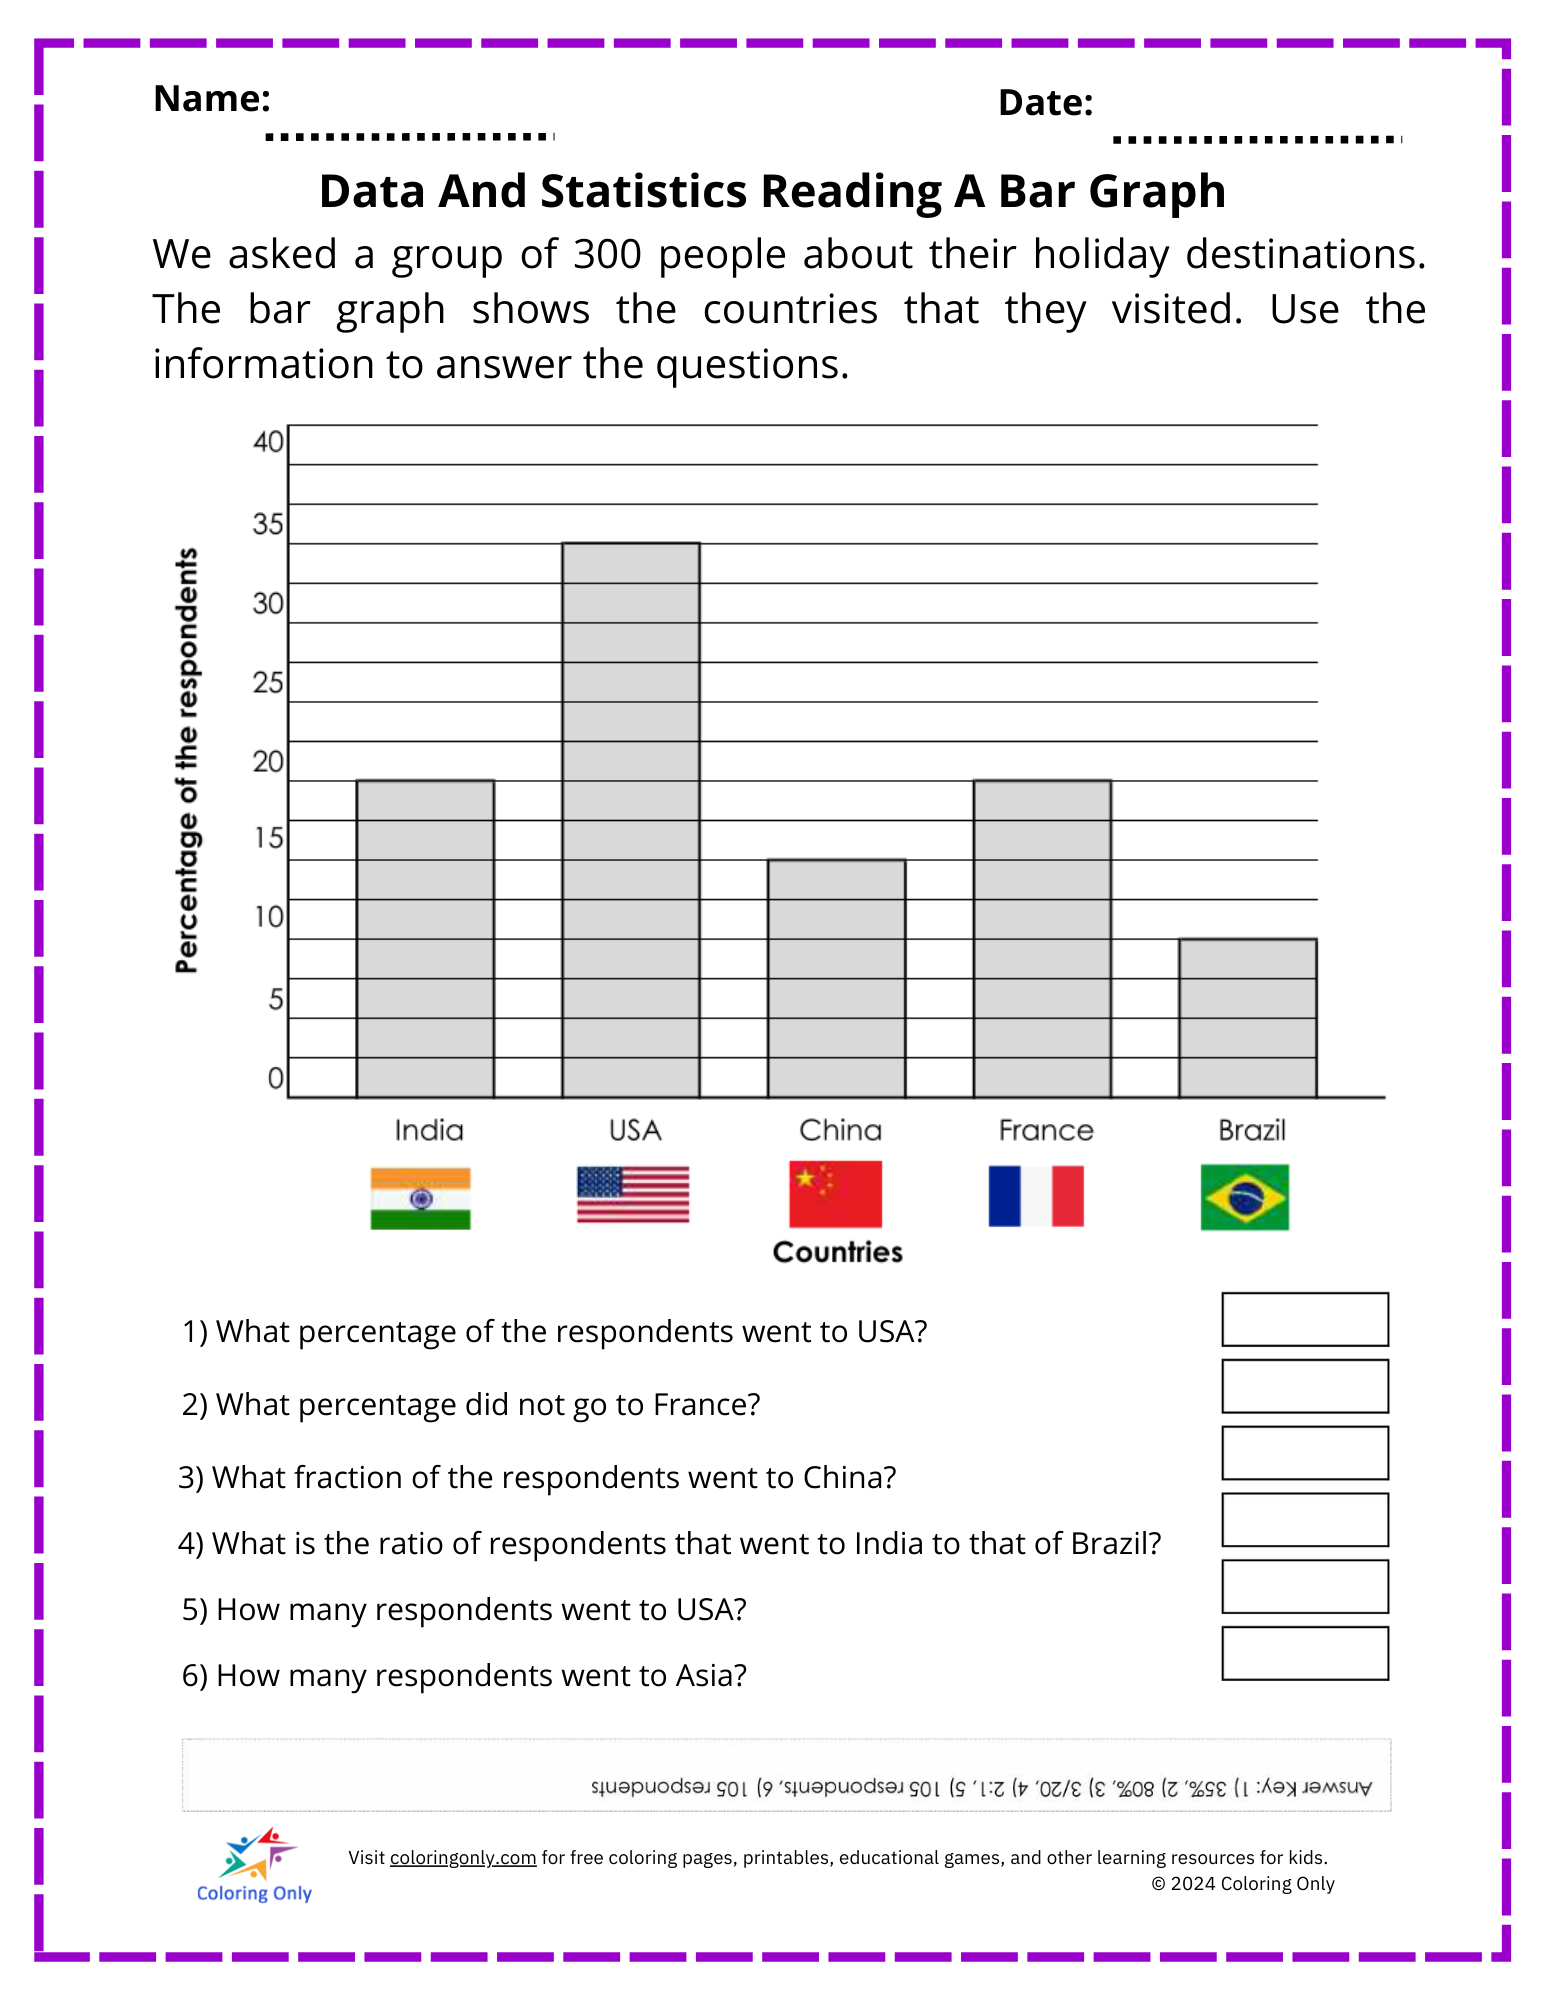
Kids how to interpret bar graphs with this Data And Statistics Reading A Bar Graph Free Printable Worksheet! This engaging activity presents a survey on holiday destinations, displayed in a bar graph. Students will analyze the data to answer questions related to percentages, fractions, and ratios, helping them develop key math and data analysis skills. Perfect for elementary students, this Data And Statistics Reading A Bar Graph Free Printable Worksheet is ideal for classrooms, homeschooling, or extra practice at home.
 Finger Painting Free Printable Worksheet
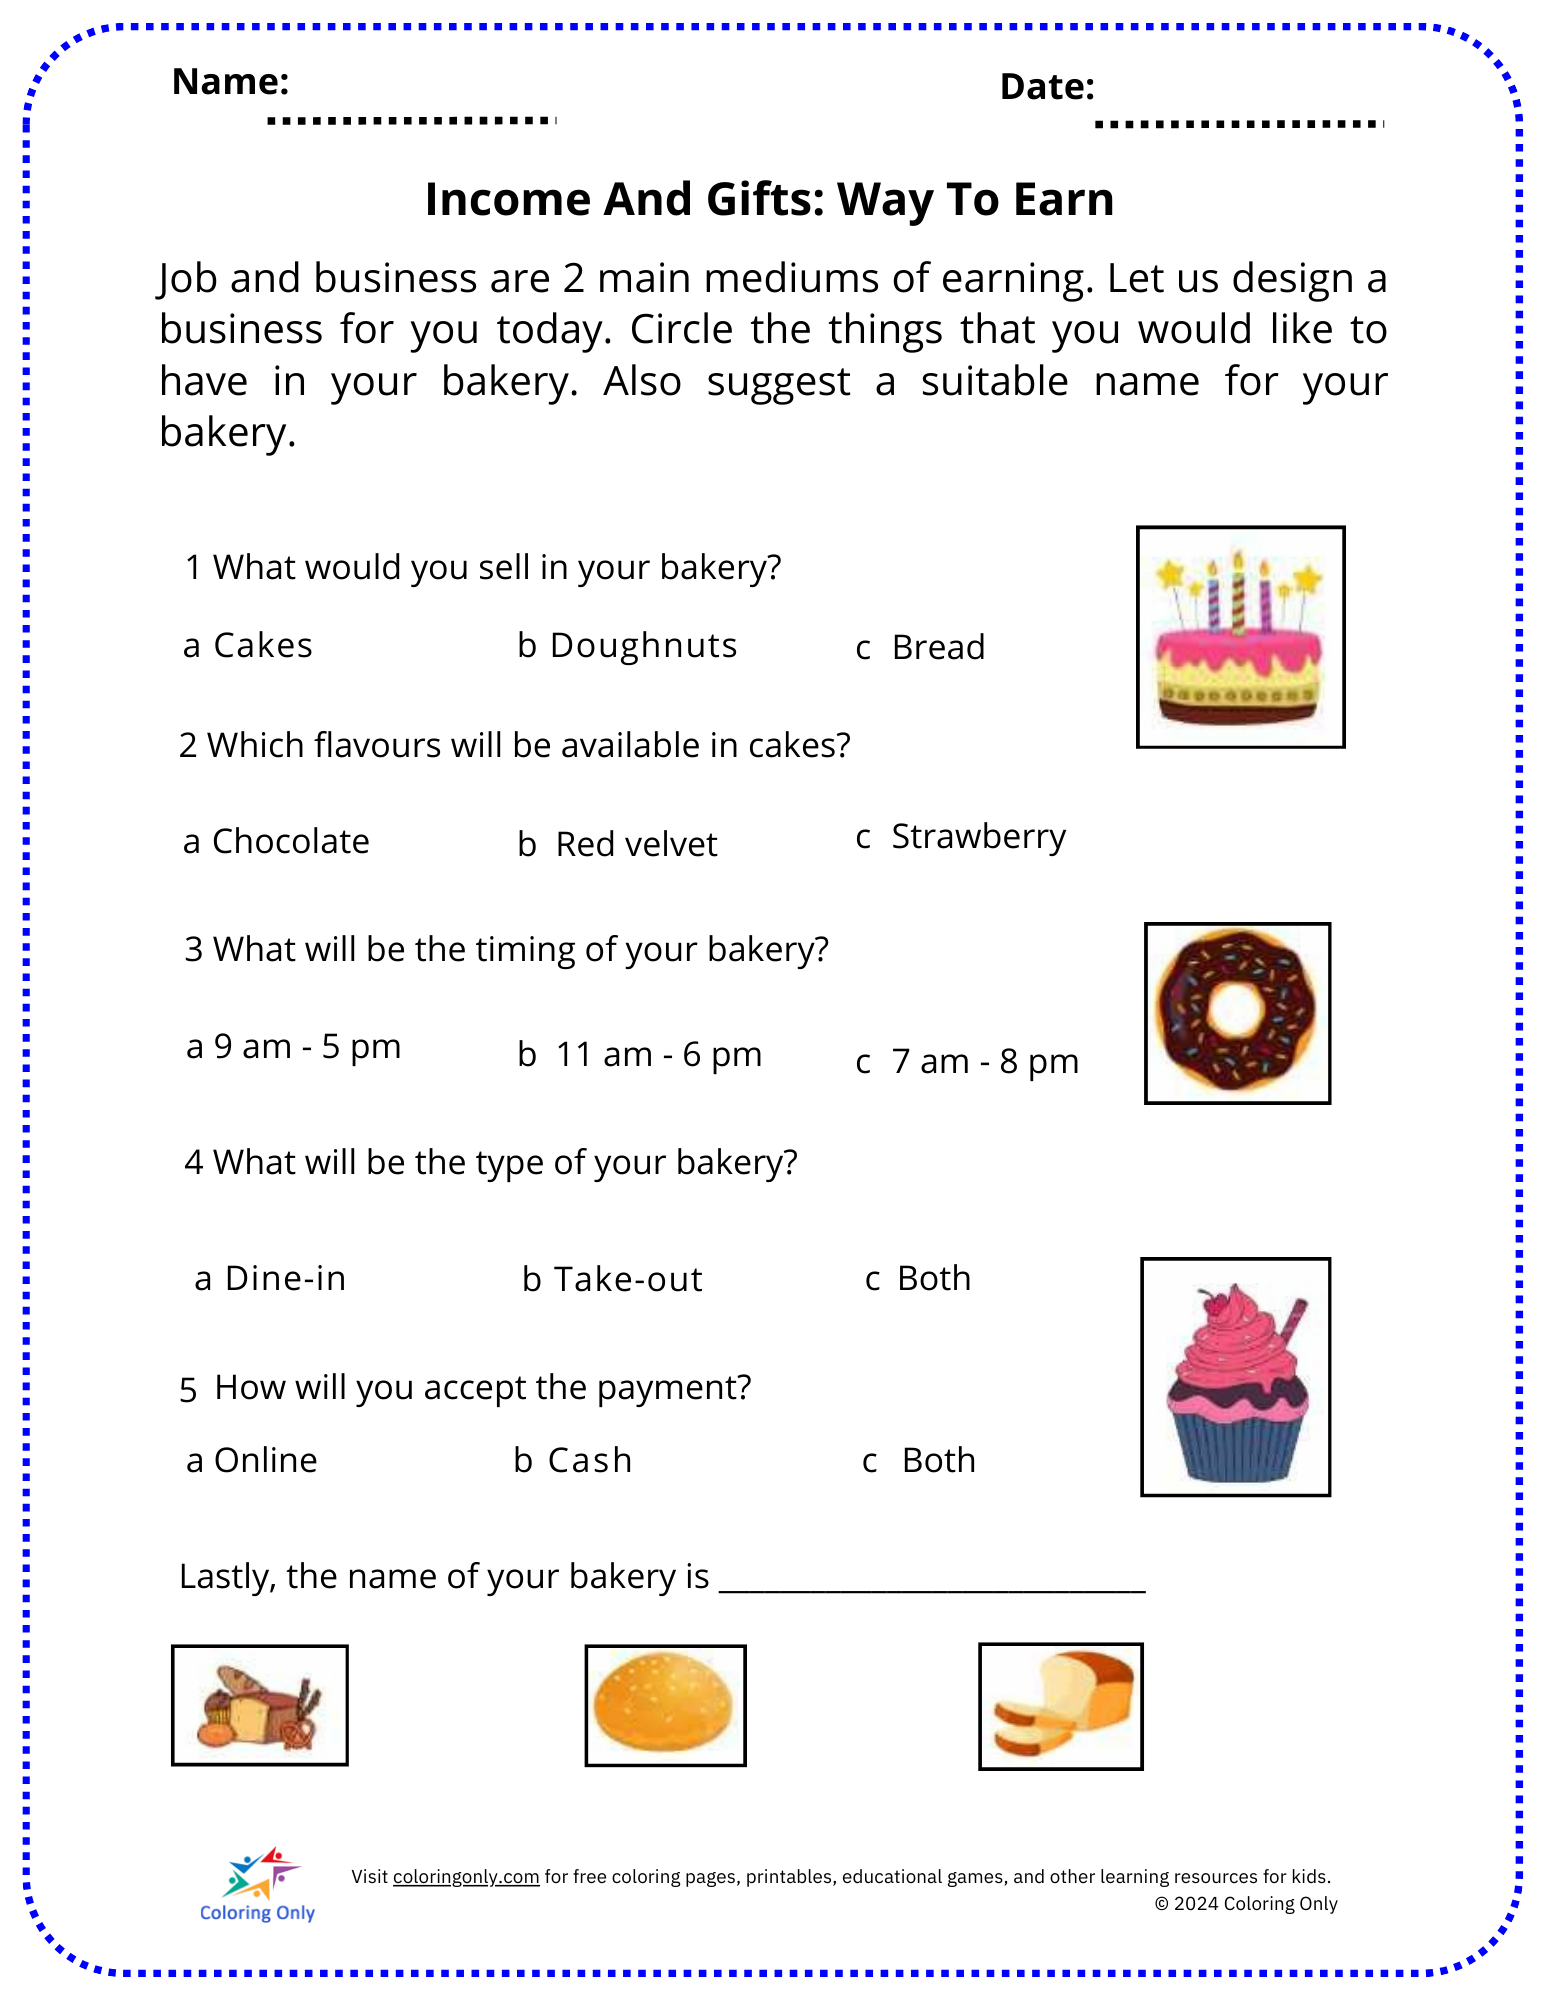
 Choose And Circle Free Printable Worksheet
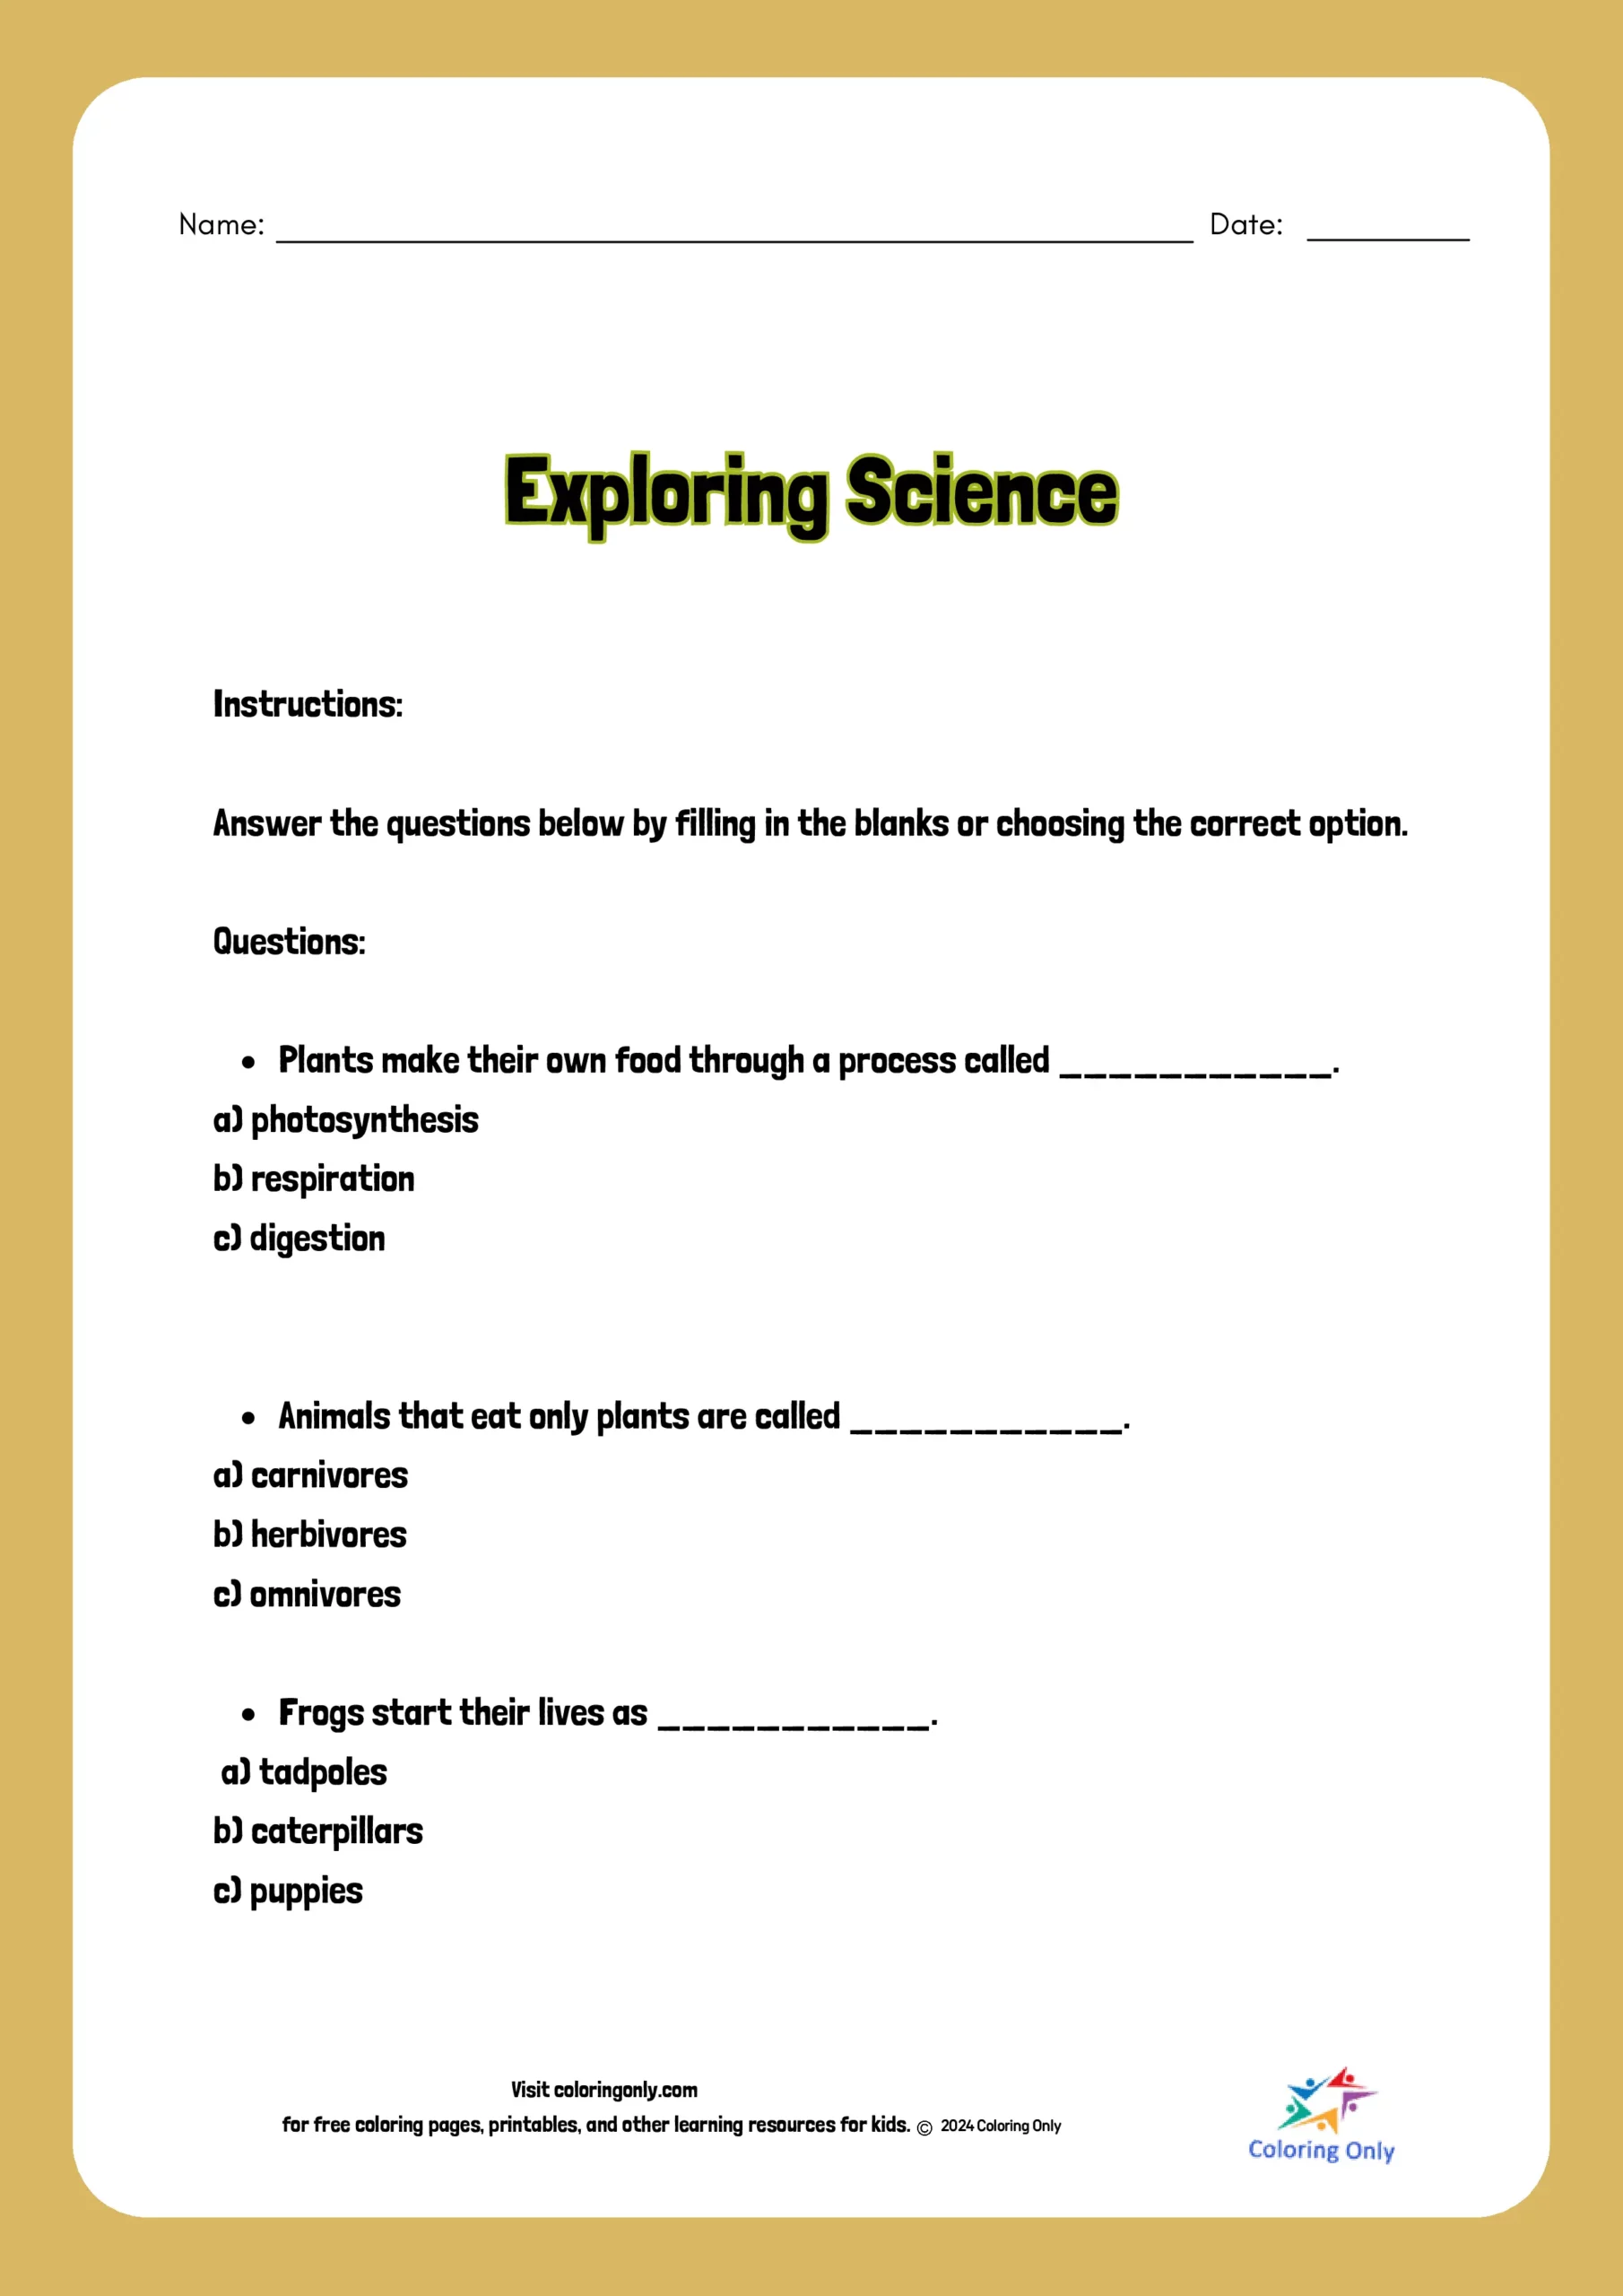 Exploring Science Free Printable Worksheet

 Dinosaurs: Make Your Own Dino Free Printable Worksheet